Software and technology
The classic concept of GIS is that of a complete software application which implements all the tools needed for working with geographical data: creating or editing, managing, analyzing and visualizing. Along with that, other types of applications have appeared which, although they do not match exactly that definition, have to be considered as part of the GIS world.
We will divide GIS applications into three main blocks: desktop GIS, web-based GIS, and mobile GIS. They will be described in detail in this chapter. We will also provide additional information about some technologies that they are based on.
Desktop GIS
There are five fundamental functionalities of a desktop GIS: data input and output, visualization, editing, analysis, and map design. Most desktop GIS tools have these five capabilities, although the level of functionality for each of them might differ. Some tools might be more prepared for data editing, while others might focus on analysis.
Data input and output
A desktop GIS must be able to read data and, optionally, to save it. This last functionality is needed in case the GIS can produce new layers, but not in those that do not contain analysis or editing capabilities.
There are a very large number of data formats for geographical data, and most GIS use common libraries to be able to read and write them, allowing them to share data among them and improve their connectivity.
Apart from being able to read data files, it is now also important to be able to connect to databases and remote services. We will talk about those later in this chapter.
Visualization
Visualization is a fundamental capability of GIS. It is, of course, important when the main purpose of using GIS is to create cartography, but also when our work is focused on data editing or analysis, since visual exploration of the data is a previous step.
The visualization part of GIS is mainly comprised of a canvas on which layers are rendered. The user can add or remove layers, and also change their symbology, that is, the way in which the layer data is converted into graphical elements. Layers are rendered in a given order which allows to create a rendering hierarchy.
Along with the canvas, there are navigation tools that allow the user to modify the area that is being displayed by zooming in, zooming out or panning (Figure 8.1).
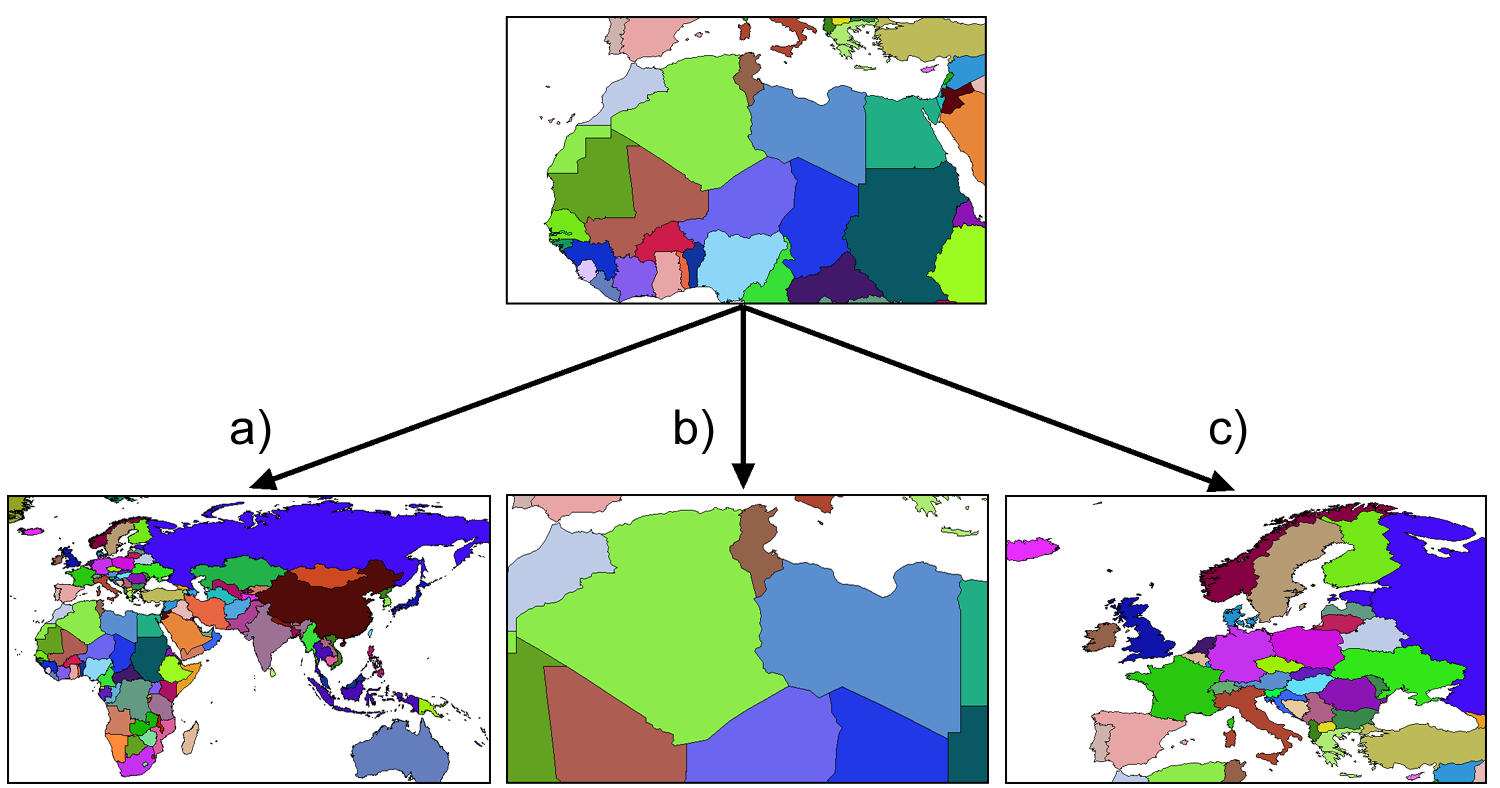
The most remarkable feature of geographical data visualization in GIS is that, unlike what happens with a classic printed map where its characteristics cannot be changed, the user can select what he/she sees and how he/she sees it. Geographical data is independent of the information needed to visualize it and, therefore, it can be represented in different ways. This is true even for data that has an inherent visual nature, such as images, since even in that case the rendering can be adjusted and modified by the user.
Although in the most common case the canvas is bidimensional, certain GIS are also capable of three-dimensional rendering. In this case, navigation tools are more complex and they allow for adjusting perspective, vision angles or vertical exaggeration, among other parameters.
Analysis
Analysis is a fundamental functionality of GIS since its origins. Others, such as visualization, although we cannot imagine GIS without them nowadays, were very limited in the early days. Analysis, however, has always been at the core of GIS.
The current trend in GIS is to consider analysis capabilities as modular tools that are run on a base platform which includes the data input and output capabilities, along with the visualization component. Analysis tools are independent, but they can be used together to create more complex analyses.
Analysis tools might be completely independent of the visualization component or be linked to it. In the first case, the analysis is performed on a set of layers and parameters without any interaction with the map while in the second case, the user might interact with the view to define how the analysis is performed (for instance, selecting a coordinate or a region in the canvas which will then be used as a parameter for the analysis tool).
The result of an analysis tool in GIS can be geographical (a new layer) or not (a simple value, such as the one resulting from some statistical analysis of the input data).
Analysis tools can be organized into workflows which helpautomate analysis routines. Also, the analysis functionality of desktop GIS can usually be used from scripting languages, which allow definition of more complex models and data flows. This is one of the main strengths of current GIS tools, since it provides the user more power and flexibility.
Editing
The geographical data with which we work in GIS are not static. Information contained in a layer might have to be changed or corrected, and the functionality that allows the user to do that is important if we want the GIS tool to be versatile. Without them, geographical data lose part of their potential, and that is the reason why most desktop GIS tools implement editing capabilities to some extent.
This capabilities can be used to create new layers or to update existing ones. The following are some editing tasks that can be performed with GIS:
- Editing the geometries of a vector layer feature.
- Editing the attribute values of a vector layer feature, including editing the list of attributes of the layer, adding or removing them.
- Adding new features to a vector layer or removing existing ones.
- Editing cell values in a raster layer.
Tools used to edit geometries inherit a large part of their design from CAD software. In certain cases, they are extended with new functionalities, as happens in the case of editing geographical data with topology (CAD software does not consider topology).
Map design
Most desktop GIS are capable of producing cartographic documents which can later be printed and used as a classic paper map. These documents are composed in the GIS from the data, and use the same functionality that it is used for the on-screen rendering (symbology, etc.).
Along with that, other tools allow the user to design and compose the map, and to adjust its elements (rendered layers, legend, title, etc.), and are inspired by those found in design software.
Some desktop GIS include elements to automate cartographic production, such as templates or tools to generate map series (Figure 8.2).
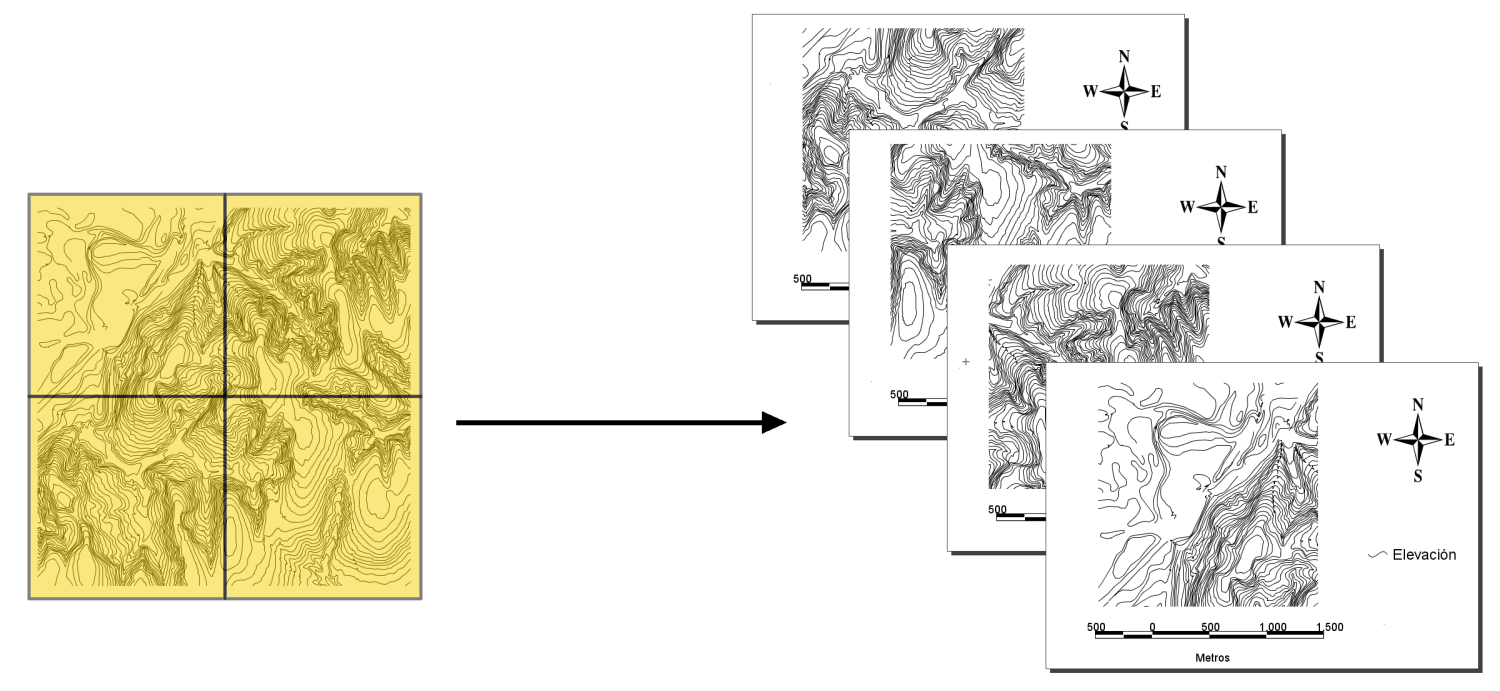
This is possible thanks to the separation between geographical data and the design of the cartographic document, similar to what we noted for the case of visualization.
Web mapping. Clients and servers
One of the most relevant advances in the history of GIS is the advent of Web mapping. Web mapping technologies are used to incorporate GIS elements as part of websites, with internet browsers being then the base platform on which GIS functionality is executed. These technologies include not just the elements run on the browser, and have been key in shaping and developing others such as remote data services, which are used not only by Web Mapping applications but also by desktop GIS.
The concepts of server and client are fundamental in this context. Let's discuss them in a bit more detail.
A server is the element that provides (serves) a given content through the network. In our GIS context, this content means basically geographical data. The client is the element that requests the data, receives it and works with it.
A web browser is a client, since it makes a request to get the content of a website and shows it to the user. When we enter a web address in the address bar of a web browser, we provide the information needed to establish the connection between the server and the client and to transfer the data from one to the other.
Let's see how that works. Suppose that we want to visit the following website:
http://victorolaya.com/writing
The requests is done based on the web address —more technically, a Uniform Resource Locator (URL)—, which is a reference to a web resource that specifies its location on a computer network and a mechanism for retrieving it. We can divide it in the following parts:
- http: The protocol to use, which defines the way client and server will communicate with each other.
- victorolaya.com: The host name. This part identifies the server machine connected to the network where the page that we want to visit is stored. It is a human-readable version of a numeric code that indicates the address.
- writing: The page we want among all the ones that the server can provide.
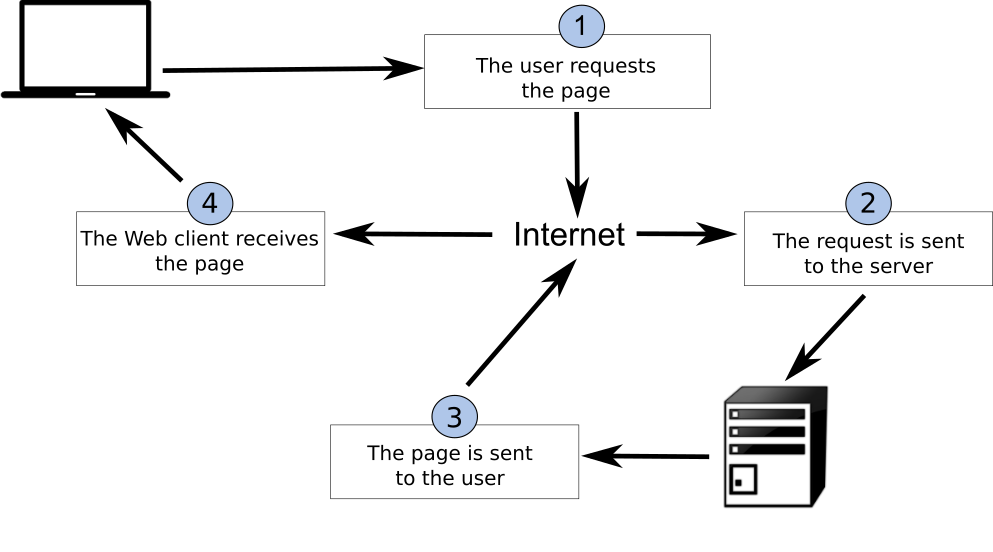
The process that allows us to have that page in our web browser comprises the following steps:
- The client makes the request.
- The server machine is identified and the request is driven to it.
- The server prepares the page that has been requested and sends it back to the client (or it sends an error message in case it could not find or prepare the page).
- The client receives the page and renders it so the client can see it.
Figure 8.3 shows a summary of this.
A relation is established between clients and servers, in which an arbitrary number of clients connect themselves to a server, from which they obtain data whenever each of them makes a request. In this client-server architecture, the server has the data to be shared through a service, while clients only provide information about themselves needed to validate and perform the data sharing.
Now let's see how these ideas apply to the field of GIS.
Regarding servers, they can have four main capabilities:
- Serve rendered geographical data. Generally known as map servers, they provide maps. That is, images created from geographical data. If data is already an image (such as an aerial or satellite photograph), the server will just send it as it is. If data is not an image (vector layer or raster layer other than image), the server will create an image based on the geographical data. The symbology used to do this can be a default one that the server uses for all requests or it can be provided by the client in the request.
In both cases, the client also specifies the dimensions of the requested map image that is served, and then the server prepares it.
- Serve the data directly. A more flexible option is to serve the geographical data itself. The client requests the data and once it has been transmitted across the network, can use it however he/she needs. In case the data is to be visualized, the symbology has to be set in the client side, since the server is not taking care of that and provides the raw data.
- Serve the result of queries. Another functionality that the server can have is to return not just the full set of geographical data, but a subset of it. The client can specify a filter and the server will use it to create a subset that will later be sent in the response. Also, the server can provide descriptive values about the data it has. The client, which might be connected to several services and obtain the values, can use those values to filter which services to use (for instance, asking them the extent of their data and then selecting only those that have data about a given study area). As we have already seen, metadata have a great relevance in this context, since they allow this kind of queries to be executed (and the corresponding requests to be responded to) efficiently.
- Serve processes. Finally, a server can provide new data, whether geographical or not, computed from geographical data. In this case, the server provides a processing service, and it processes the data that is passed to it as part of the request. The request can contain the data itself, or a reference to it. If a reference is passed, the data might already be in the server, or it can be in another one. In this last case, the first server will become a client of the second one, will retrieve its data, process it, and send back the result to the original client (Figure 8.4).

Figure 8.4: Remote processing service using data from a second server.
About clients, they can be divided in two classes:
- Heavy clients. Heavy clients are independent applications that do not run on top of another one such as a web browser. They usually have a larger size since the application has to care of all the program logic.
Heavy clients handle and use data not coming from web services, such as local data files. They are not just clients, but full-fledged applications that work even without its client part.
Nowadays, most desktop GIS are heavy clients themselves as they have the functionality of classic GIS but can also consume web services.
- Light clients. They normally have a smaller size and their capabilities are more limited. They run on web browsers and most of the time rely on remote data from servers.
Although originally, they focused on data visualization (adding map views to websites, with a certain degree of interactivity), they have begun to implement more advanced functionalities such as analysis functionality (whether on the client side or using a processing service) or data editing.
The term Web mapping is used to refer to the lighter clients which focus only on rendering maps, while the term Web GIS is used for those with more functionality, incorporating some of the tools traditionally found in desktop GIS.
Some techniques related to GIS services
Two important techniques used in the context of the client--server architecture for geographical data are tiling and caching. These techniques, whether implemented on a light client or a heavy one, allow for more responsive interfaces and reducing the amount of data sent over the network, overcoming to a certain extent the problems that a slow network might cause. Both are used mainly with map servers (servers that provide rendered images).
Tiling divides the images that the client is working with into smaller ones, forming a mosaic. By correctly managing the tiles in that mosaic, the amount of data transmitted can be reduced. When the request is sent to the server, instead of a single image, a set of them is requested. Although this does not reduce the amount of data, the tiled structure will allow a more flexible and optimized handling of data once a new image is needed, as will soon be explained.
Caching is a technique frequently used not just for web SIG, but as a general tool in the context of the internet. Web browsers store previous responses from web servers, such as web pages and images, in a so-called cache. When data that was previously requested is requested again, it can be taken from the cache instead of from the corresponding server, which is usually faster and more efficient.
Combining tiling and caching increasing responsiveness and results in an optimized data management. Let's see how that works, using the example shown in figure 8.5.
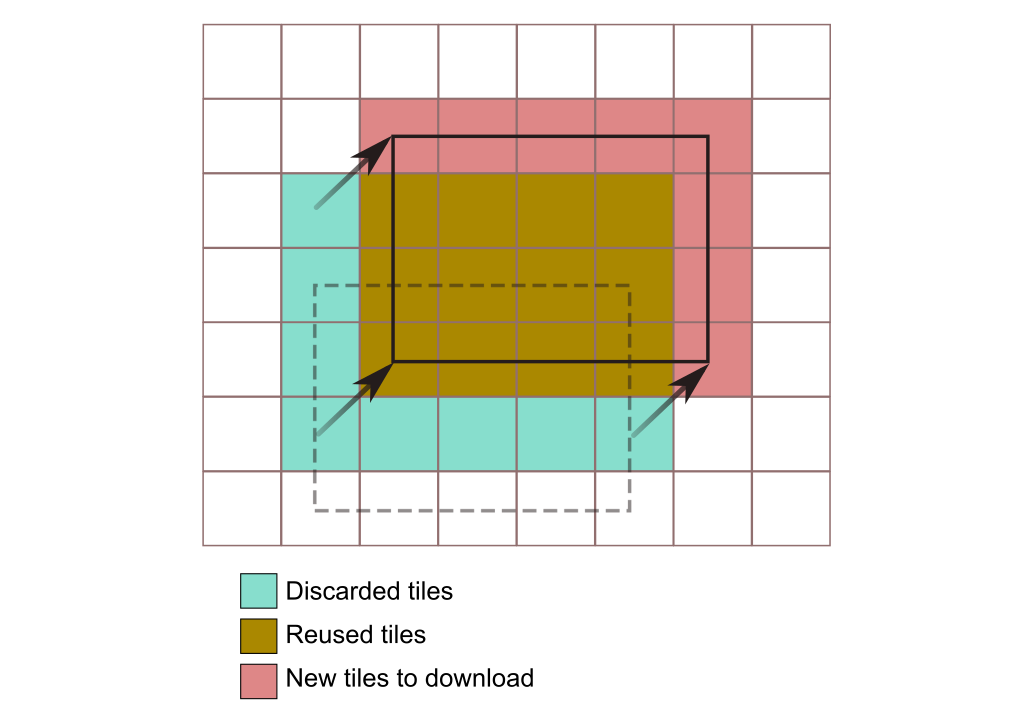
Initially, the application displays an area that cover 20 elements or tiles. All those tiles have already been downloaded from the server, and stored in the application cache, which means that using them again does not require making a new request to the server. Without caching and tiling, when the application user changes the area to be displayed as shown in the figure, a whole image has to be requested, with exactly the same size as the image to be rendered in the screen. However, if tiling and caching are applied, we just have the whole new image to be painted divided in 20 parts, and, since some of them are stored from a previous request, we just have to request a small number of them (8 in this case, corresponding to the areas not covered by the previous image). The amount of data that is requested to the server and transmitted over the network is much smaller.
Caching can also be implemented on the server side. We have seen that map servers provide already rendered images based on some data. Rendering that data can be time consuming and, if it has to be done for each request, that would mean a lot of computing cost for the server. Instead, images are pre-rendered at different scales so when a client request is received by the server, it just has to crop the pre-rendered image instead of producing the response image from the base data.
A recent technique that is gaining popularity is vector tiling. Using the same approach as in the case of the tiling we have just seen (that is, cutting the data in pieces), vector layers are divided and only the required data are sent to the client.
This allows the client to request and use vector layers and be responsive at the same time. Without vector tiling, this would be impossible for large layers. The advantage in this case is that the symbology can be defined by the client. Also, the user experience is improved, since for instance, transitions become more fluent when changing the map scale, due to the scalability of vector data.
Standards
To ensure the the client-server system works correctly, it is important to define how the communication between servers and clients takes place. Some normalization is needed, and there must be common and well-defined elements implemented by both the client and the server. This lingua franca that allows clients and servers to communicate is what we call a standard.
In an ideal situation, a complete interoperability would exist independent of formats and applications used. Clients and servers would be able to connect with each other, regardless of their own characteristics. Standards are the element that allows that to happen, because they define a common framework in which clients and servers communicate. As long as a client or a server follows the standard, it will be able to communicate with all others that do it as well. Standards provide technological homogeneity.
Interoperability means that any element of the client-server system can be replaced with another one, and the interaction between all parts of the system will not be affected. A client or server might have different functionalities, but regardless of its origin (its manufacturer), it will be able to interact with the other elements, if all implement the same standard.
A standard is considered as such when it is used by a group or community, which accepts it to define the characteristics of a product or service within it. Standards can be established by public acceptance and custom (de facto standards) or they might have legal recognition and be proposed by some official organization (de iure standards).
A standard is open if its definition is available to everyone who wants to know more about it and use it for any activity related to it.
The following are some of the fundamental principles that open standards are based on:
- Availability. Open standards are available to anyone, to read and to use.
- Maximize end-user choice. Open standards create a fair, competitive market, and do not lock users in the closed environment of a given vendor.
- No royalty. Implementing a standard is free and has no cost, unlike the case of a patent.
- No discrimination. Open standards and the organizations behind them do not favor any implementer of the standard over the rest of them.
- Extension or creation of subsets. Standards can be extended with additional elements or reduced to less-detailed subsets.
To know the impact that a standard has in the context of GIS, let's take a look at figure 8.6, which represents a non-interoperable architecture that does not use standards.
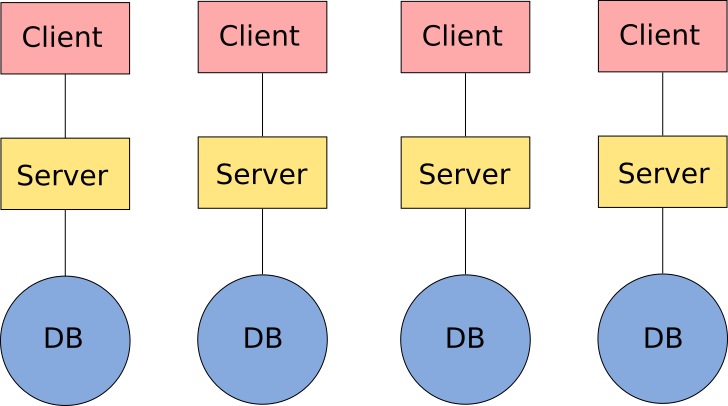
Data stored in each database are available only by using one client, the one corresponding to the server that serves those data. The remaining data are not available for that client. Each client-server-database group is an independent island, technologically isolated from the rest of them.
Disadvantages of a non-interoperable architecture like that include the following:
- Waste of resources. Each service must manage its own data. That is complex and has higher costs than sharing data with other compatible services.
- Need to know multiple clients. Since we need a different client for each service, the user must be familiar with all of them. Being capable of using just one client is not enough to use all the available data, since that client can only access a small part of all that data..
- Combining data is not possible. Two datasets that are available through two different services cannot be used in the same client, as it cannot communicate with the corresponding servers.
- Combining functionalities is not possible. If data is only available to a given client, the functionality in another one (which might not be implemented in the first) cannot be used on that data. When working with that data, the user's possibilities are limited to what the corresponding client can do.
Now let's take a look at a fully interoperable architecture based on open standards, as seen in figure 8.7.
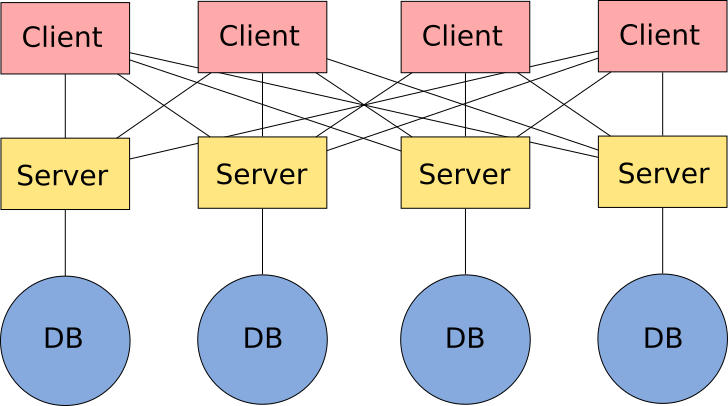
In this case, there is a server that manages and offers the services for each database, but all clients can access all servers, since they are based on open standards and communication is possible between any two of them.
Relevant standards in GIS
The most common standards for geographical information are created and promoted by the Open Geospatial Consortium (OGC). The OGC is ``an international not for profit organization committed to making quality open standards for the global geospatial community''.
Some of the most relevant OGC standards are the following ones:
- WMS. To serve maps (images)
- WCS. To serve coverages (currently only raster layers).
- WFS. To serve geographical features and attributes (vector layers). It can also allow editing features from the client.
- WPS. To serve remote processing services.
- GML. To store geographical information.
- CSW. To make queries to a catalog that contains geographical data.
Each one of these standards is described in the corresponding specification, which is subject to change and improvement. Several versions exist for each of them.
Along with these standards are those made by organizations such as ISO o W3C, with a more general scope, but also important in the context of GIS. Among them, the most relevant standards are the ISO ones that define how to store metadata and the W3C standards related to communication over the Internet.
Mobile GIS
GIS on mobile platforms such as mobile phones or tablets has a clear relation with both desktop GIS and web GIS. It takes the elements from them and adds others derived from running on a mobile platform which expand their possibilities.
Mobile devices nowadays offer two main capabilities from the point of view of GIS: wireless access to Internet and ability to know the position of the device.
Internet access can be used to obtain maps and geographical information from a given server, or to send field data acquired with the aid of the mobile device.
The position of the mobile device is usually known based on the GPS receiver that is part of most mobile phones. However, other approaches are also possible, from computing the position based on the phone network to using some indoor positioning system if it is available.
Knowing the position of the device allows the mobile GIS application to provide additional functionality. For instance, it might be used to make field data acquisition easier and more efficient (the coordinates of measured points do not have to be entered manually), or to provide location-based services (LBS).
Some of the main groups in which these services can be grouped are listed next.
- Navigation. Shortest path computation, route guidance, etc.
- Data acquisition. Any type of data can be registered in the field, and the device associates to them its own position automatically.
- Information. Business directories, travel guides, etc.
- Advertising. Location-based advertisements, promotions for nearby shops, etc.
- Tracking. Of both people and products, along predefined routes or arbitrary ones.
- Management. Of infrastructures, installations or fleets.
When running in a mobile platform, a GIS has additional information about the context it is running on (position, direction of movement, speed, illumination, etc.), that it can use to provide more functionality than a desktop or web GIS running on a non-mobile platform.